It’s kind of funny how one post can lead to another sometimes. This one is pretty basic but it also just shows a bit how useful I find knowing my way around computer systems to be. Yesterday I posted about my little annual music playlists. And as part of that, I wanted to actually post the playlist. I am pretty sure there is a fairly universal “playlist file type” out there and being open source, I had assumed that VLC on my phone stored the playlists somewhere in playlist files.
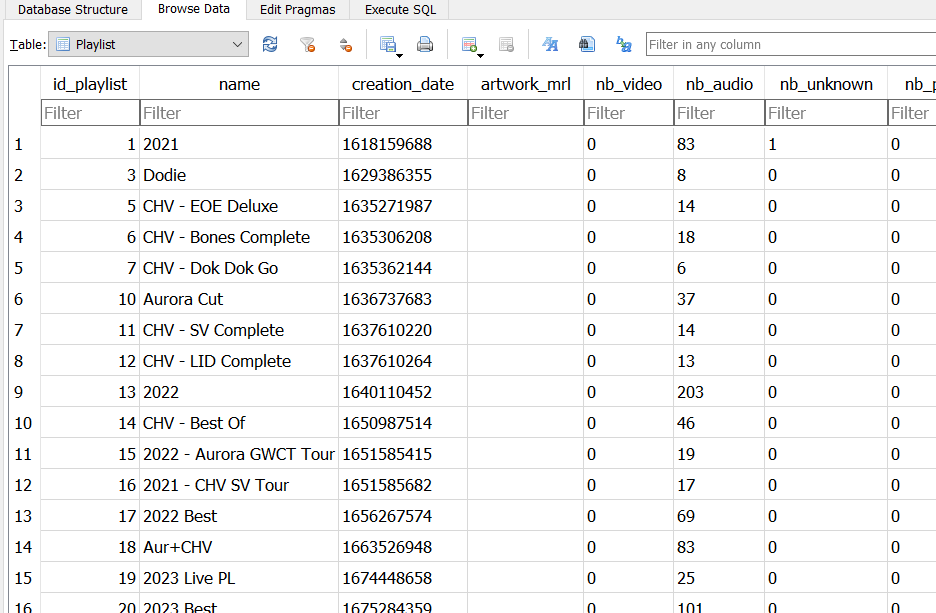
That assumption was wrong, it uses a .db file. A little portable database. There is an option to dump this file to the root of the phone, presumably for backup purposes, but it’s also useful to just browse it like I am doing here. The file itself can be opened and browsed with SQL Lite’s DB manager. It’s standard databases inside for tracks and artists and playlists.
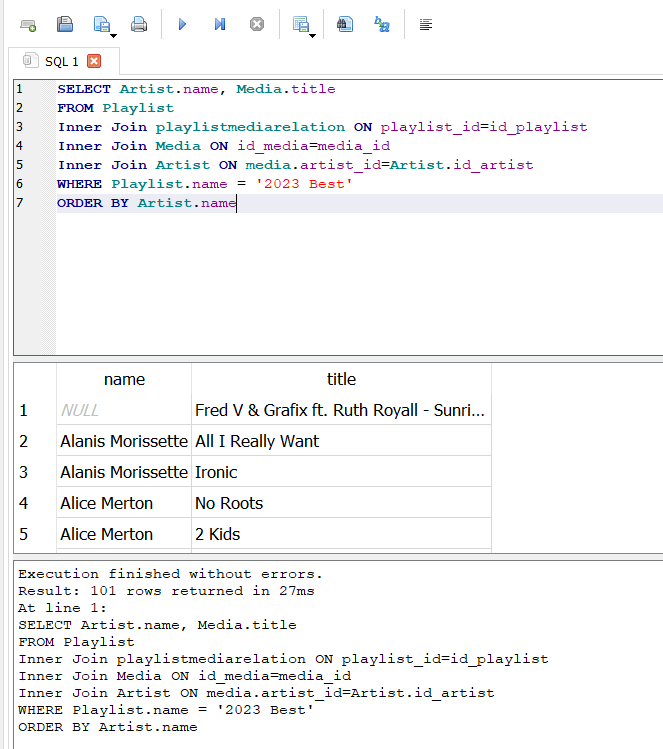
Fortunately, I have had some experience dealing with database queries, so I set about building what was needed tog et the data I wanted. Pull the Playlist I want, in this case “2023 Best” but I could change that to do any available Playlist. This gives the tracks by id, but the tracks themselves are stored in a separate table for media. So that needs joined in. The media table stores track names, but not artist names, so an additional join is needed to get the artist names. This complicated things a bit because both the playlist table and artist table have a column “name” so more clarity needed to be added.
The result was this little query that dumps out a basic table of Artist and Song title.
SELECT Artist.name, Media.title
FROM Playlist
Inner Join playlistmediarelation ON playlist_id=id_playlist
Inner Join Media ON id_media=media_id
Inner Join Artist ON media.artist_id=Artist.id_artist
WHERE Playlist.name = '2023 Best'
ORDER BY Artist.name
Now, I could have done some cute clever trick now to merge the two into a new column and add in a ” – ” between but it was easier to drop it all into a notepad file and do a fine/replace on the weird space character that it stick in between the Artist and track title.
The added bonus here is I can easily use this query again anytime I want to dump a Playlist to text.
Josh Miller aka “Ramen Junkie”. I write about my various hobbies here. Mostly coding, photography, and music. Sometimes I just write about life in general. I also post sometimes about toy collecting and video games at Lameazoid.com.
So, this isn’t going to really have any code. I might, sometime int he distant future, publish some code, but this whole thing is very much a “add things as I go, ongoing project. The base code itself isn’t particularly complicated though. It’s a pretty simple HTML/PHP/CSS layout that wraps around various modules I’ve been building. I keep mentioning the Dashboard though when talking about the various projects, so I figure I should do a quick run down on what the Dashboard involves.
I’m actually building a more complex iteration of this project at work as well, to be used internally by my work group. The work one is considerably more complex, for example, it has a much more robust Admin area that is growing with features to manage locations, manage users, manage user teams, etc. The base layout framework is shared between the two dashboards, but the work one has a lot more actual functionality. Because I am the only one using the home version, I generally just code everything in, so it’s less modular. I also have to translate any code I write for one or the other version between the different Database back ends. I use MySQL at home, I use MS SQL at work.
At it’s base, it’s just a webpage on my project webserver that displays information. Some of that information is useful, some is just there to fill space and to practice coding something up. i mentioned above, it’s essentially a Header, sidebar, and Footer that wrap around a variable content box. On the home page, the content box contains what I have been calling “Quick Cards” with bits of information, that sometimes link to larger chunks of data. This is what it looks like, at the moment, on the home page.
I’ll dive in a bit on some of the menus and content but I am going to start with the Quick Card boxes, in order.
The Weather box seemed like an obvious choice for at a glance information. I want to make it link to a sub page with more forecast data, but for now, it just displays the current weather conditions for my location. Unfortunately it’s built on the Dark Sky API, which very recently announced is closing down, so I’ll have to find a new API to use.
Next is the COVID-19 stats widget. This is the other side of the COVID-19 Tracking Python Script I posted recent. It just pulls and displays the most recent information that the script has pulled. I may update this to link to a page with some timeline graphs on it, once I figure out how to put a data graph in a webpage.
Network devices is the most robust of all of the modules I’ve built so far. The Quick Card just shows the current number of active devices on the home network. Clicking it opens the Network Device page I talk about here.
Social Accounts is just link list to the various Twitter Accounts I have. I want to change this to be a modifiable list eventually, but for now it’s just a list. It does do a database pull to build the URLs, but I have not added a configuration page yet.
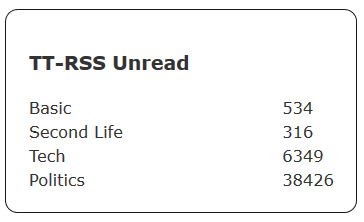
The next box displays how many unread posts are on each of my TT-RSS accounts. After Google killed Google Reader, I set up TinyTiny-RSS on my webserver and started using it for my feeds. I became overwhelmed so I broke all of my feeds into themed sub accounts. I would link to each sub account, but it’s all the same link, just with a different log in, so the links would be useless. Normally, I just use container tags to keep the different log in instances open.
Lastly is a tracker for Reddit Karma for several Reddit Accounts I have. Like my RSS feeds, I have broken my Reddit subs out into seperate themed accounts. i don’t really care that much about Reddit Karma, but I wanted to play around with APIs and JSON, so I figured this would be an easy project. I will probably post the script used in the future, but it’s essentially identical to the recently posted COVID-19 script. In fact the COVID-19 script was adapted from the Reddit Karma script.
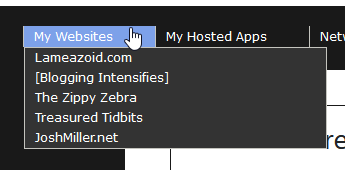
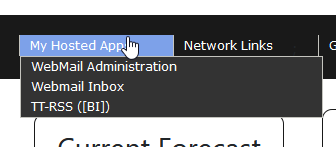
Along the top navigation bar are some drop downs with useful links that don’t really have “At a glance” data. The first two, “My Websites” and “My Hosted Apps” are just drop downs with links to the Blogs I manage and my Webhosted apps for Email and TT-RSS.
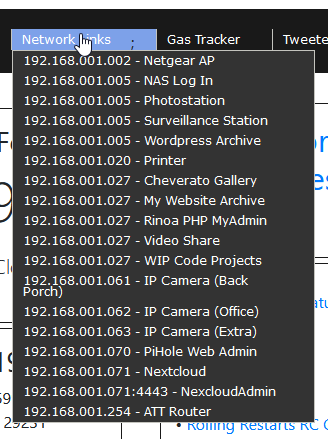
The next drop down is similar in nature, in that it’s a list of links, but this one has an admin page so I can maintain the list as it changes. It also hasn’t quite found a home yet. I had it in the sidebar for a while, then I had it in a Quick Card, now it’s int he Navigation menu. It’s a list of links to web services on my internal home network. It’s linkes to Routers, Raspberry Pis, IP Cameras, my NAS, and to various things I have set up on my Project Server.
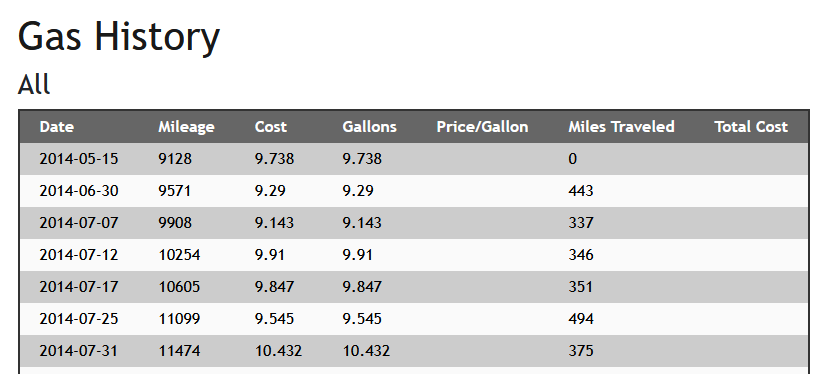
Next to that is the Gas Tracker, which is very much a WIP page. When I bought my car back in 2014, I decided I wanted to track my Gas consumption for the life of the car. Currently this lives in an Excel Spread Sheet on One Drive. I wanted to see about translating it into my own webpage and using SQL as the back end. Currently it just displays a table of data that I imported from Excel. There isn’t any way to add new data yet and it doesn’t calculate the Price/Gallon or total money paid or anything like that.
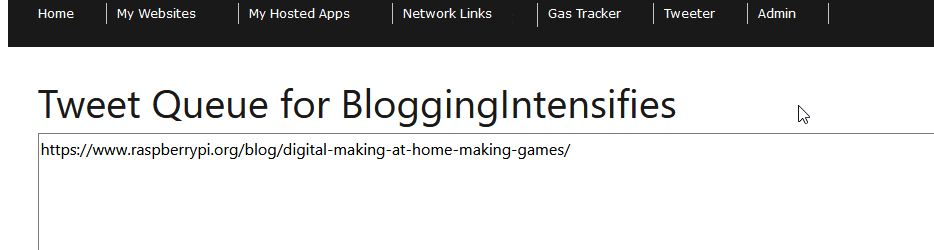
Lastly is an old project I did called Tweeter that I got up and running again and embedded into the Dashboard. Tweeter itself is fairly self contained and I will probably do a couple of detailed write ups on it in the future and post the code at that time. I also want to update it to use SQL as the back end so I’ll do a second write up when that happens.
A while back, I was looking for a way to automate posting Tweets, mostly so I could share links to articles, but have them space out over the course of a day. I couldn’t find a decent free service, and thus, Tweeter was born. Tweeter is a two part solution, it’s a PHP page that writes a text file, and some scripts (python and bash) that runs on a schedule and posts the contents of that text file to Twitter, one line at a time, on whatever cron schedule is set. I’m not going to go into anymore here, but I promise to post about it int he future. It’s also a little ugly and probably insecure as hell, but it works well.
The main fun of integrating Tweeter, the box is 140 characters wide, the same as a tweet. So I had to modify my core code framework to have a toggle for pages that don’t display the sidebar. It wasn’t anything complicated, but I hadn’t considered that need, and so I fixed it. That’s kind of part of the fun and point of doing these sort of code projects.
Josh Miller aka “Ramen Junkie”. I write about my various hobbies here. Mostly coding, photography, and music. Sometimes I just write about life in general. I also post sometimes about toy collecting and video games at Lameazoid.com.
I wrote a bit about my Network Map Webpage recently. It’s part of a larger home dashboard project I’m working on, but as part of that I’ve updated things a bit to make them more streamlined and easier to use. The biggest problem with the page as it was originally coded is that it shows everything. I’ve cycled most of my regularly used electronics onto the network so they could be captured by an arp scan, though not all of them are on all the time. For example, I still have a Raspbery Pi and Arduino set up to capture temperature data. I also have several Next Thing CHIP devices, though Next Thing has gone out of business. In total, between my IOT stuff and laptops, phones and tablets and the duplicate IPs from the network extender, I have 55 devices in the raw table.
So I set out to make this more manageable at a glance. My original query in my PHP code looked something like this:
SELECT ip, arpscans.mac, arpscans_known_macs.device_name, arpscans_known_macs.device_description, last_seen, device_owners.user_name FROM arpscans LEFT JOIN arpscans_known_macs on arpscans_known_macs.mac = arpscans.mac LEFT JOIN device_owners on device_owners.id = arpscans_known_macs.device_owner ORDER BY ip
By slipping in “WHERE last_seen >= NOW() – INTERVAL 5 MINUTE” just before ORDER BY, I can make the code return only currently connected devices. The ARP scan runs every 5 minutes, anything that has a last seen time stamp within 5 minutes is assumed to still be attached. This interval could be shorted to almost real time, but I don’t really need that much of a check.
I can also view all disconnected devices with a simple change of the above command, making it “WHERE last_seen <= NOW() – INTERVAL 5 MINUTE”. This wouldn’t work if I were still keeping historical data, but I essentially only capture the last seen data for any device. Essentially what this does is return everything not seen in the last 5 minutes.
I also broke out my PHP code that builds my table from my query into it’s own PHP function. This was I could set the variable $SQL for the active devices, call the function to build the table, then set $SQL for inactive devices and build a second table, under the first.
I immediately scrapped this, because it was ugly. Plus, sometimes I do want to see “everything”.
Enter some GET calls and an if/else statement.
	if($_GET['show'] == "active") {
	// SQL for selecting active devices
	$tabletitle="Active Devices";
	$sql = "SELECT ip, arpscans.mac, arpscans_known_macs.device_name, arpscans_known_macs.device_description, last_seen, device_owners.user_name FROM arpscans LEFT JOIN arpscans_known_macs on arpscans_known_macs.mac = arpscans.mac LEFT JOIN device_owners on device_owners.id = arpscans_known_macs.device_owner WHERE last_seen >= NOW() - INTERVAL 5 MINUTE ORDER BY ip";
	}
	elseif($_GET['show'] == "inactive") {
	// SQL for selecting active devices
	$tabletitle="Inactive Devices";
	$sql = "SELECT ip, arpscans.mac, arpscans_known_macs.device_name, arpscans_known_macs.device_description, last_seen, device_owners.user_name FROM arpscans LEFT JOIN arpscans_known_macs on arpscans_known_macs.mac = arpscans.mac LEFT JOIN device_owners on device_owners.id = arpscans_known_macs.device_owner WHERE last_seen <= NOW() - INTERVAL 5 MINUTE ORDER BY ip";
	}
	else {
	// SQL for Selecting all devices
	$tabletitle="All Devices";
	$sql = "SELECT ip, arpscans.mac, arpscans_known_macs.device_name, arpscans_known_macs.device_description, last_seen, device_owners.user_name FROM arpscans LEFT JOIN arpscans_known_macs on arpscans_known_macs.mac = arpscans.mac LEFT JOIN device_owners on device_owners.id = arpscans_known_macs.device_owner ORDER BY ip";
	}
Basically, if nothing, or a random string is passed by the URL variable “show”, then it goes to the end, and displays everything when accessing the page at index.php. If it passes index.php?show=active, it sets $SQL for showing active devices and if it gets index.php?show=inactive, it shows inactive devices. It also sets a variable called $tabletitle which is just echoed out into some header tags. I then added links across the top of the page to each of these filters.
This allows for a quick and easy toggle of which data is pulled and displayed.
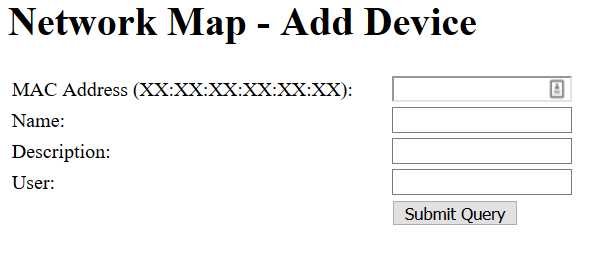
Additionally, I updated the way the Add Device form works. Previously, the form would fill in the MAC, a Device Name and a Device Description, then it would POST to another PHP page that would insert the data into the table, then forward on back to the index page with a header redirect. I’m not going to get into too much detail on it here, but I also integrated the Network Map into my dashboard framework with a header, navigation, sidebar, and footer. It also uses a table based navigation system, so in order to view the network map, I am hitting “index.php?page=4”. Pages basically all need to be wrapped in this structure to work properly, so in order to make things flow better, the Add Device form now POSTs back to the Network Map page itself, which checks to see if the POST variables are set, and if they are, it inserts the new information, before pulling the table.
This also meant slightly altering my page calls to look for “index.php?page=4&show=active” and “index.php?page=4&show=inactive”.
Eventually I want to move the Add Device form to appear at the top of the page, so the whole thing is all handled in one single page.
Lastly, I made up a quick block of code in it’s own page, that simple counts and displays the number of currently connected devices on the network. This block is embedded on the front page of my Dashboard Framework and links to the full Network Map page. The general idea on the Dashboard is to have widgets like this that show quick glance information, with links to detailed information.
I have not built a lot of them yet, but one of the others I have built works somewhat similar to the ARP scanning system. A script makes a call to my TT-RSS instance for each of the segmented accounts I have, then dumps the unread count into a table on the server. The widget shows how many unread articles each topic/account has. I am still really bad about only actually reading the Basic feed (mostly Toys and Video Games).
But I will get into the Dashboard Widgets thing a bit more in a future post probably.
Josh Miller aka “Ramen Junkie”. I write about my various hobbies here. Mostly coding, photography, and music. Sometimes I just write about life in general. I also post sometimes about toy collecting and video games at Lameazoid.com.
I want to start off by saying, there isn’t going to be a ton of code here, and if there is code, it’s going to be super dirty. I’m fairly good at making code for “private use” that is pretty insecure, and not so great at code that’s scrubbed up and user friendly to distribute to others.
I’ve been working a bit on some local code projects, specifically for my little private “Dashboard” that runs on my file server. One project I’ve wanted to try for a while is a dynamic network tracker tool. I’ve looked into some options available, and they all seem to run as a plug in for some complicated 3rd party analytics software that often has some goofy complicated set up procedure that’s beyond “apt-get” or even just dumping a bunch of files in a web server directory.
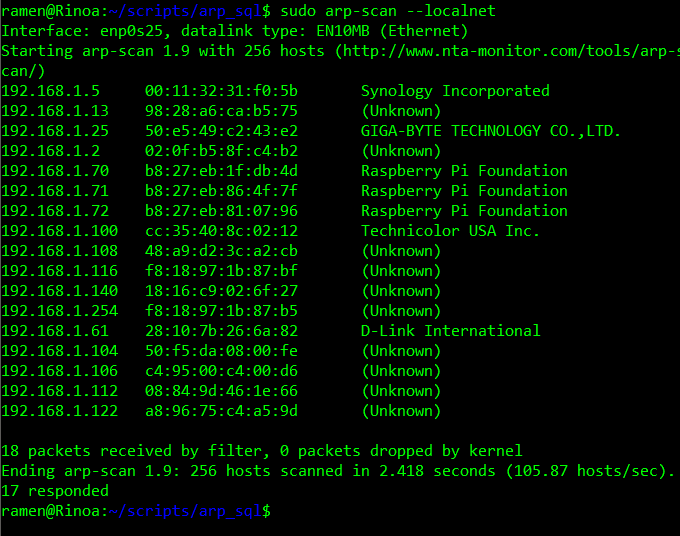
This project is both kind of simple and not. It was fairly simple in set up and execution, but it’s somewhat complex in design. The first job was getting a list of currently connected devices on the network. This is easily done via the command line with an arp-scan request.
sudo arp-scan --localnet
The output of which looks something like this:
Using a pipe, I can shove all of this into a text file, which contains everything above.
sudo arp-scan --localnet | scan.txt
The trick is, how to display this output on a webpage. One way would be to pull it from a database. Pulling data from MySQL is pretty easy, dumping it to a pretty looking table is also easy. The harder part is getting the output of arp-scan to MySQL in a useful manner.
This is where Python comes into play. I am sure there are other methods or languages available, but like Python, and mostly know how to use Python. Essentially, I wrote a script that would open the file, scan.txt, that was created above. I am only concerned with lines that contain IP addresses, so I used the function “is_number()” to check if the first character of each line is numeric, if it is, it runs through a couple of operations.
Firstly, the output of arp-scan is tab delimited, so I can use the “split” function on “\t”, and dump the result into an array. This gives me an array of the IP address, MAC address, and Manufacturer. This sticks a new line in with the Manufacturer, so I did a “replace” on \n in the third item of the list. Lastly, I wanted the IPs to be uniformly formatted, so I write a little function that would add in leading zeros to the IP octets.
Finally, the Python builds an SQL statement from the line’s list, and make a call to the server to insert the values. A modified version of this code that just displays the resulting SQL commands instead of executing them is below.
#!/usr/bin/python

# Open a file

def is_number(s):
        try:
                float(s)
                return True                                                         except ValueError:
                return False

def format_ip(ipstring):
        octets = ipstring.split(".")
        n=0
        for i in octets:
                while(len(i)<3):
                        i=add_zero(i)
                octets[n]=i
                n=n+1
        return octets[0]+"."+octets[1]+"."+octets[2]+"."+octets[3]
        #return ipstring

def add_zero(shortstring):                                                          return "0"+shortstring


import MySQLdb

mydb = MySQLdb.connect(
  host="localhost",
  user="YOURSQLUSERNAME",
  passwd="YOURSQLPASSWORD",
  database="YOURTARGETDATABASE"
)

mycursor = mydb.cursor()

fo = open("scan.txt", "r")
#print ("Name of the file: ", fo.name)

fo.seek(0)

# read each line of the list
for line in fo:
        #check for lines that contain IP addresses
        if is_number(line[0]):                                                              #Convert lines into list
                line_list = line.split("\t")
                #remove line delimitors
                line_list[2]=line_list[2].replace("\n","")
                #Make IP Octets 3 digits
                line_list[0] = format_ip(line_list[0])
                SQL = "INSERT INTO arpscans (ip, mac, mfg) VALUES ("+line_l$                print SQL
fo.close()
It’s not super pretty, but it was a quick way to make sure everything came out looking correct. The table I used is called “arpscans” and contains columns called, “ip”, “mac”, “mfg”, and “last_seen”. The time stamp is an automatically generated time stamp.
I then created a shell script that would run the arp-scan piped into scan.txt then runt he python script. I set up this script in the root crontab to run once every half hour. Root is required to run the arp-scan command, so my user crontab wouldn’t cut it. Everything ran fine when I manually did a run of the script using sudo. The PHP on the other end out output the latest values based on the time stamp to a webpage.
This is where I ran into my first major hurdle. The script wasn’t running in cron. After a lot of digging and futzing, I found that basically, when cron runs the script, it works off of different environmental variables. I had to specify in ,y bash file, specifically where each command existed. The end result looks something like this:
Eventually the scan was running and posting data automatically as expected. After a few days, I ran into my second major issue. There was simply put, way too much data for my crappy old “server” to handle. The webpage slowed to a crawl as the table contained something like 9000+ entries. It’s possible and likely that my query was also rubbish, but rather than stress more figuring it out, I modified all of the code again.
Instead of adding a new entry for every MAC address every scan, I changed it to check if there already was an entry, and simply update the last_seen time. I had originally designed the system with the idea of getting legacy data for attached devices, but decided I only really cared about a generic history.
The new webpage table now displays all devices, current and previously seen, with the last seen date.
A few issues came up on the output end as well, though none of them were super hard to correct. One, I wanted a way to sort the table by clicking the headers. There are several scripts you can toss in your code to do this online.
I also wanted more data about each device, so I added a form where I could fill in more data about each device. Specifically, the network name, if there was one, a description of what the device is, the User of the device (which family member or if it’s just a network device). This also checks and updates based on MAC address.
I also ran into an issue with MAC addresses and my Network extender. When devices are connected to the Network Extender, the first half of the MAC is replaced with the first part of the Extender’s MAC, though they retain the last half. I may eventually write some code to detect and merge these entries, but for now, I’ve simply been labeling them in the description as “(Extender)”, so I know it’s the same device on the other connection.
The final end result looks something like this:
I used to have the network super organized before I moved, but the new router doesn’t work nicely with my Pi DHCP server, so I have not gotten things quite as nicely sorted as I would like. Everything in the picture is sorted, but above .100, it’s a mess. I also can’t assign IPs to some devices at all, like the DirecTV gear or my Amazon Echos, which is really annoying.
One of my future projects will hopefully correct this, as I want to put a second router on the network with DD-WRT, between the ISP gateway and everything else.
Overall, it’s been a fun little exercise in coding that combined a lot different techniques together in a fun way.
Josh Miller aka “Ramen Junkie”. I write about my various hobbies here. Mostly coding, photography, and music. Sometimes I just write about life in general. I also post sometimes about toy collecting and video games at Lameazoid.com.
Today, I’ll cover how I’m receiving and displaying that data on the server side. I’ll put the code for the webpages into this post but I’ll put everything together in a nice little package at the end of everything. I mentioned last post that the end trick was to let the server worry about processing the data instead of the Arduino. I’m running this on my NAS but it could be run on any standard web server with PHP and SQL.
For the purposes of this code, I’ve placed the files in a directory called “temps” on the root of the web server. If you want to put them elsewhere, such as “temperaturelog” or “home/temps” or wherever, you’d need to alter the code of the Arduino in the previous points to replace the temps directory with the directory you plan to use. I’m going to assume that the reader has a basic LAMP (Linux, Apache, MySQL, PHP) stack style server and knows the basics of how to create databases and run things on it. If not you can Google the basic set up, though I may do a quick write up and reference it here eventually.
You’ll need to create a database called “housetemps” and import the linked structure file into it. (If you know what you’re doing in PHP you can rename housetemps) This will create a table int he database called “temperature” with the following columns: id, event, sensor, celsius, humidity, datestamp. This will give you the basic structure needed to run the php code on the server. A quick rundown of what these values are used for…
id – A standard auto incriminating id value for SQL
event – Time and date of when the event happened
sensor – A text based identifier for each probe. This example uses one probe but could be altered for more.
celsius – The temperature reading, it doesn’t actually have to be Celsius, that’s just the default of the probe.
humidity – Humidity reading in percent humidity
datestamp – A date only time stamp, used for sorting the data when you review it later.
Now that you have the core database structure set up, the server needs to know the credentials for connecting to the database. Since this is used by several files, it’s best to put the info in it’s own file and use an include statement int he PHP to add it.
In the “temps” directory create a file dbconnect.php and add int he following code, changing the values listed for the values used when setting up the database…
<?php
$MyUsername = “USERNAME”; // enter your username for mysql
$MyPassword = “PASSWORD”; // enter your password for mysql
$MyHostname = “localhost”; // this is usually “localhost” unless your database resides on a different server
// Go to the review_data.php (optional)
header(“Location: review_data.php”);
?>
The code is pretty straight forward. The first section includes our previously created log on credentials. The last section forwards the page on to review the data. The meat is in the middle with the SQL statement. The line $dateget = date(“Y-m-d”); creates a Year-Month-Day date for sorting later. The next line creates the SQL query using variables passed via the url, the third part executes this query adding the data to the database.
The final piece of this whole thing is the review_data.php file. This file displays the results in a nice looking table.
<?php
// Start MySQL Connection
include(‘dbconnect.php’);
?>
<table border=”0″ cellspacing=”0″ cellpadding=”4″>
<tr>
<!– <td class=”table_titles”>ID</td> –>
<td class=”table_titles”>Date and Time</td>
<td class=”table_titles”>Sensor Serial</td>
<td class=”table_titles”>Temperature in Celsius</td>
<td class=”table_titles”>Percent Humidity</td>
</tr>
<?php
// Retrieve all records and display them
$SQL = “SELECT * FROM temperature WHERE datestamp LIKE ‘”.$_GET[“dateselect”].”%’ ORDER BY id ASC”;
//Execute the SQL
$result = mysql_query($SQL);
// Used for row color toggle
$oddrow = true;
// process every record
while( $row = mysql_fetch_array($result) )
{
if ($oddrow)
{
$css_class=’ class=”table_cells_odd”‘;
}
else
{
$css_class=’ class=”table_cells_even”‘;
}
The core of this file was lifted from the previously mentioned guide on Tweaking4All. The problem I had with their results was that it simply displayed an endless list. I am polling every 15 minutes, so this list tends to grow unwieldy very quickly. This is where the datestamp marker comes into play. I added this little chunk of code at the top of the table.
<?php
$sql = “SELECT DISTINCT datestamp FROM temperature”;
$result = mysql_query($sql);
This creates a menu based on unique values of datestamp. Selecting a value forwards you to review_data.php with a date attached, then review_data.php only shows data that matches that datestamp. This allows a single day to be viewed easily. In the future I may add a bit more to this menu, eventually, the list of dates will also become unwieldy in length. I also plan to run numerous sensors at once with different names so I’ll likely also add a second menu so the list can be sorted down by sensor name.
I’m also looking to add a bit more functionality to the code in the form of a graph, so it will be easier to see trend lines in the data. The data I have now is from my office, in a well insulated basement room, so the trend lines are rather boring, but when there are several sensors in different rooms in the main area of the house, or even outside, this data becomes more interesting and useful. I’ll go into this at a later day though…
Josh Miller aka “Ramen Junkie”. I write about my various hobbies here. Mostly coding, photography, and music. Sometimes I just write about life in general. I also post sometimes about toy collecting and video games at Lameazoid.com.