One Month on Windows 10

windows-10-logoI held off a bit on the whole “Free Update to Windows 10” thing.  I’m still a bit apprehensive on the whole issue, it feels like there might eventually be a “catch” of some kind.  There probably isn’t, more likely, it’s just an attempt to get everyone on the same page so to speak.  It makes everything better and easier for them.  Easier for security, easier to maintain, easier for developers to make apps they “know” will work.

It’s part of the beauty of phones, on some level, they are all mostly the same.  Except of course for the 50 different versions of Android floating around due to manufacturer cruft and skins and carrier differences and phones that don’t get updated, etc etc.  Still, even if 50 wasn’t an exaggeration, it’s a small fraction of the potential different versions of Windows out there from XP, Vista, 7, 8, 8.1, 10, Monthly and weekly patches, Service Packs and updates.

So, anyway, it’s been about a month since I did the upgrade on my Windows 7 desktop.  I’m generally happy with it all around, aside from my one major issue.

The Good

It’s not Windows 8.  Windows 10 has a lot of the best features of Windows 8, but it doesn’t have the annoyances.  The goofy full screen start screen mostly, I have no idea how that would work on my multi monitor set up.  It doesn’t have the annoying charms bar or crap popping in and out all over on the edges.  It does have the live tiles and all that jazz.

It runs just fine, I haven’t really noticed an increase or decrease in performance honestly.

It also has the store, which is a nice optional way to get programs and apps and other things.

The Bad

ScreenShot394
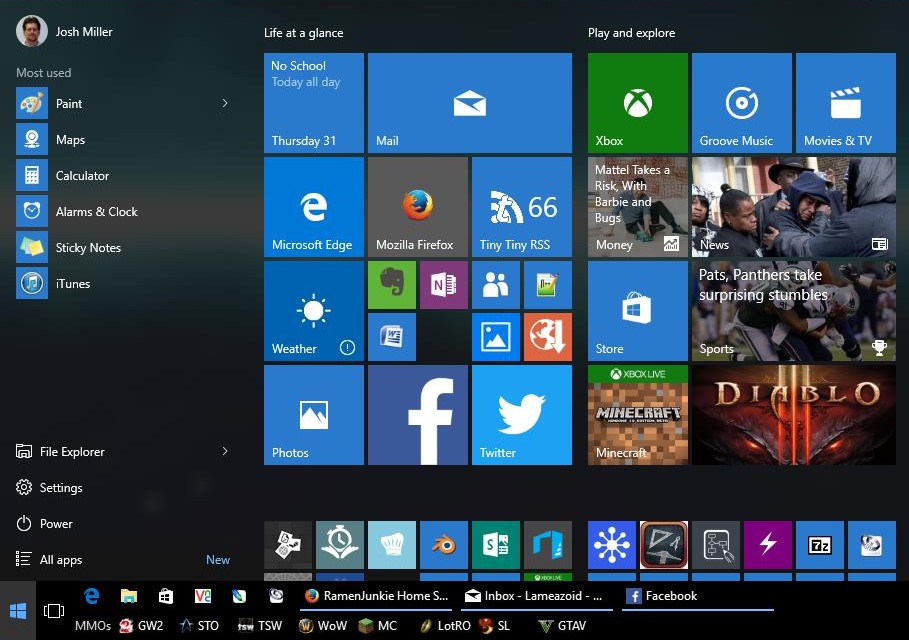
Apps and live tiles are great, if they work.  They don’t seem to work very smoothly at all.  Most of the time they just show their basic icon.  On the other hand, it’s kind of frustrating when they have a live tile photo of some kind because now the app isn’t obvious.  I don’t know how many time I went looking for the Facebook app because it had someone’s profile photo on it.

Groove Music is a horrible piece of crap.  This is Microsoft’s music store/player.  I had similar issues on my phone with Xbox Music.  I have a decent collection of music, from the free promo Microsoft ran last year to the 10 cent sale they ran this year, I have quite a few albums.  The thing is, I also have music from Google, and a lot fo music from Amazon and some ripped from CDs.  I manage all my music as local files, or with the Synology Music player on my NAS.  This means downloading the files, which you can do with Groove music, when it doesn’t time out or fail, or reload thinking it hasn’t downloaded any files yet.  There also isn’t any way to manage the download Queue at all, even basic controls like a pause function would be nice.  Instead, I can start some downloads, then walk away, but if I want to halt things to clear up bandwidth, I have to close the program, which screws everything up again.

The Really Really Ugly…

I don’t know the root cause, I new will, but the Windows 10 November Update totally screwed up my machine.  In searching for the fix, I found others had had the same issue and it’s a relatively special case.

I dual boot Ubuntu Linux, which means when the machine boots, it brings up the boot loader, GRUB, which has configuration files on the Linux partition.  I rarely actually use this other OS, especially since I get my Linux fix on  my Laptop these days, but it’s there.  Honestly, part of the reason I still keep it around is because I don’t want to hassle with removing GRUB.

This update, apparently messes witht he partition tables, and potentially the partitions themselves, because during the update, my machine became unable to boot.  It restarted and I got an error in GRUB that it couldn’t detect any OSes.  I went and found a boot repair tool from Ubuntu, but the tool did nothing.  Eventually I opted to simply reinstall Ubuntu, thus reinstalling and restoring GRUB, and I found what seemed to be a large chunk of “Empty Space” on my main drive.  I reinstall Ubuntu into the hole, ran the repair tool, which fixed the base install since it could now see an OS, then reconfigured GRUB to see Windows.

I fixed it, but it was a massive hassle, one that shouldn’t have been an issue.

I seriously hope this doesn’t happen with any future major releases, the next should be in 2016 with Redstone 1.

Pushing Arduino Data to MySQL via PHP Part 2: The Server

tempdataIn the last post, I talked about how to send data from the Arduino to the MySQL server.

Today, I’ll cover how I’m receiving and displaying that data on the server side.  I’ll put the code for the webpages into this post but I’ll put everything together in a nice little package at the end of everything.  I mentioned last post that the end trick was to let the server worry about processing the data instead of the Arduino.  I’m running this on my NAS but it could be run on any standard web server with PHP and SQL.

For the purposes of this code, I’ve placed the files in a directory called “temps” on the root of the web server.  If you want to put them elsewhere, such as “temperaturelog” or “home/temps” or wherever, you’d need to alter the code of the Arduino in the previous points to replace the temps directory with the directory you plan to use.  I’m going to assume that the reader has a basic LAMP (Linux, Apache, MySQL, PHP) stack style server and knows the basics of how to create databases and run things on it.  If not you can Google the basic set up, though I may do a quick write up and reference it here eventually.

You’ll need to create a database called “housetemps” and import the linked structure file into it.  (If you know what you’re doing in PHP you can rename housetemps)   This will create a table int he database called “temperature” with the following columns: id, event, sensor, celsius, humidity, datestamp.  This will give you the basic structure needed to run the php code on the server.  A quick rundown of what these values are used for…

  • id – A standard auto incriminating id value for SQL
  • event – Time and date of when the event happened
  • sensor – A text based identifier for each probe.  This example uses one probe but could be altered for more.
  • celsius – The temperature reading, it doesn’t actually have to be Celsius, that’s just the default of the probe.
  • humidity – Humidity reading in percent humidity
  • datestamp – A date only time stamp, used for sorting the data when you review it later.

Now that you have the core database structure set up, the server needs to know the credentials for connecting to the database.  Since this is used by several files, it’s best to put the info in it’s own file and use an include statement int he PHP to add it.

In the “temps” directory create a file dbconnect.php and add int he following code, changing the values listed for the values used when setting up the database…

<?php
$MyUsername = “USERNAME”;  // enter your username for mysql
$MyPassword = “PASSWORD”;  // enter your password for mysql
$MyHostname = “localhost”;      // this is usually “localhost” unless your database resides on a different server

$dbh = mysql_pconnect($MyHostname , $MyUsername, $MyPassword);
$selected = mysql_select_db(“housetemps”,$dbh);
?>

Next you’ll need a way to get data into the table.  This is done using add_data.php, which is called by the Arduino in the code shown previously.

Make a file in the “temps” directory called add_data.php, and add the following code.

<?php
// Connect to MySQL
include(‘dbconnect.php’);

{
$dateget = date(“Y-m-d”);
// Prepare the SQL statement
$SQL = “INSERT INTO housetemps.temperature (sensor ,celsius, humidity, datestamp) VALUES (‘”.$_GET[“serial”].”‘, ‘”.$_GET[“temperature”].”‘, ‘”.$_GET[“humid”].”‘, ‘$dateget’)”;

// Execute SQL statement
mysql_query($SQL);
}

// Go to the review_data.php (optional)
header(“Location: review_data.php”);
?>

The code is pretty straight forward. The first section includes our previously created log on credentials.  The last section forwards the page on to review the data.  The meat is in the middle with the SQL statement.  The line $dateget = date(“Y-m-d”); creates a Year-Month-Day date for sorting later.  The next line creates the SQL query using variables passed via the url, the third part executes this query adding the data to the database.

The final piece of this whole thing is the review_data.php file.  This file displays the results in a nice looking table.

<?php
// Start MySQL Connection
include(‘dbconnect.php’);
?>

<html>
<head>
<title>Arduino Temperature Log</title>
<style type=”text/css”>
.table_titles, .table_cells_odd, .table_cells_even {
padding-right: 20px;
padding-left: 20px;
color: #000;
}
.table_titles {
color: #FFF;
background-color: #666;
}
.table_cells_odd {
background-color: #CCC;
}
.table_cells_even {
background-color: #FAFAFA;
}
table {
border: 2px solid #333;
}
body { font-family: “Trebuchet MS”, Arial; }
</style>
</head>

<body>
<h1>Arduino Temperature Log</h1>

<p>Select Date:
<?php

$sql = “SELECT DISTINCT datestamp FROM temperature”;
$result = mysql_query($sql);

echo “<select name=’datestamp’ onchange=’location = this.options[this.selectedIndex].value;'”;
while ($row = mysql_fetch_array($result)) {
$current = $row[‘datestamp’];
echo “<option value=’review_data.php?dateselect=$current’>$current</option>”;
}
echo “</select>”;
?>

<table border=”0″ cellspacing=”0″ cellpadding=”4″>
<tr>
<!–    <td class=”table_titles”>ID</td> –>
<td class=”table_titles”>Date and Time</td>
<td class=”table_titles”>Sensor Serial</td>
<td class=”table_titles”>Temperature in Celsius</td>
<td class=”table_titles”>Percent Humidity</td>
</tr>
<?php
// Retrieve all records and display them
$SQL = “SELECT * FROM temperature WHERE datestamp LIKE ‘”.$_GET[“dateselect”].”%’ ORDER BY id ASC”;

//Execute the SQL
$result = mysql_query($SQL);

// Used for row color toggle
$oddrow = true;

// process every record
while( $row = mysql_fetch_array($result) )
{
if ($oddrow)
{
$css_class=’ class=”table_cells_odd”‘;
}
else
{
$css_class=’ class=”table_cells_even”‘;
}

$oddrow = !$oddrow;

echo ‘<tr>’;
//       echo ‘   <td’.$css_class.’>’.$row[“id”].'</td>’;
echo ‘   <td’.$css_class.’>’.$row[“event”].'</td>’;
echo ‘   <td’.$css_class.’>’.$row[“sensor”].'</td>’;
echo ‘   <td’.$css_class.’>’.$row[“celsius”].'</td>’;
echo ‘   <td’.$css_class.’>’.$row[“humidity”].'</td>’;
echo ‘</tr>’;
}
?>
</table>
</body>
</html>

The core of this file was lifted from the previously mentioned guide on Tweaking4All.  The problem I had with their results was that it simply displayed an endless list.  I am polling every 15 minutes, so this list tends to grow unwieldy very quickly.  This is where the datestamp marker comes into play.  I added this little chunk of code at the top of the table.

<?php

$sql = “SELECT DISTINCT datestamp FROM temperature”;
$result = mysql_query($sql);

echo “<select name=’datestamp’ onchange=’location = this.options[this.selectedIndex].value;'”;
while ($row = mysql_fetch_array($result)) {
$current = $row[‘datestamp’];
echo “<option value=’review_data.php?dateselect=$current’>$current</option>”;
}
echo “</select>”;
?>

This creates a menu based on unique values of datestamp.  Selecting a value forwards you to review_data.php with a date attached, then review_data.php only shows data that matches that datestamp.  This allows a single day to be viewed easily.  In the future I may add a bit more to this menu, eventually, the list of dates will also become unwieldy in length.  I also plan to run numerous sensors at once with different names so I’ll likely also add a second menu so the list can be sorted down by sensor name.

I’m also looking to add a bit more functionality to the code in the form of a graph, so it will be easier to see trend lines in the data.  The data I have now is from my office, in a well insulated basement room, so the trend lines are rather boring, but when there are several sensors in different rooms in the main area of the house, or even outside, this data becomes more interesting and useful.  I’ll go into this at a later day though…


Pushing Arduino Data to MySQL via PHP

Arduino+EthernetThis is part of my little ongoing project of learning with the Arduino.  I want to give a mention to Tweaking4all’s guide to PHP, SQL and Arduino, because I started out using it as a base for this section of the project, though I altered a few parts to work with my sensors and Ethernet board.  That guide definitely pointed me in the right direction and made me realize just how simple it would be to actually push data to the server.

My initial approach to the problem was that I needed the Arduino to run some SQL queries and interact directly with the database and insert readings and other variables.  In the end, all I needed was a PHP file on the server to interact with the database, and the proper call from the Arduino to the PHP file.

I started out with basic code to dump dummy data (ie not variables) to a database running on my laptop.  I couldn’t get UIPEthernet linked int he Tweaking4all guide to work so I just used the default Arduino Ethernet libraries.  I also simplified the code down to one probe, though adding more temperature probes will be trivial.  After I managed to get the dummy data to post reliably, I moved on to adding variables in place of the dummy values.  Once again, I couldn’t get the OneWire library to load properly and work with my senors, so I went back to the basic DHT-11 library that I knew work.  This actually simplified things considerably, I used the same calls I had done previously in testing and instead of pushing them directly tot he serial port, I dumped them to some variables which are then passed to the SQL statement.

I also added variables and functions to read Humidity, since he original article doesn’t have humidity readings included.

The final hurdle I came across, for some reason, the delay() function wasn’t working properly.  I set it to poll every 15 minutes (in milliseconds) but it never posted a new update beyond the initial one when powered on.  If I tried a shorter interval, such as 5 minutes (in ms), I got new readings every 30 seconds or so.   In the end, I used a better method of handling time with currentmills.  This reads the current number of milliseconds since the last reading.  By reading currentmills and comparing it to the last reading “time” I can verify if it’s been 15 minutes since the last reading.  This method is not super precise and has some play on interval but I’m not doing anything requiring perfect timing with this project.

In the end, I ended up with the following code for the Arduino:

#include <SPI.h>
#include <Ethernet.h> // Used for Ethernet
#include “dht.h”

dht DHT;

#define DHT11_PIN 5

// **** ETHERNET SETTING ****
// Arduino Uno pins: 10 = CS, 11 = MOSI, 12 = MISO, 13 = SCK
// Ethernet MAC address – must be unique on your network – MAC Reads T4A001 in hex (unique in your network)
byte mac[] = { 0x54, 0x34, 0x41, 0x30, 0x30, 0x31 };
// For the rest we use DHCP (IP address and such)

EthernetClient client;
char server[] = “SERVERIP“; // IP Adres (or name) of server to dump data to
int  interval = 360000; // Wait between dumps
unsigned long previousMillis=0;

void setup() {

Serial.begin(9600);
Ethernet.begin(mac);

Serial.println(“RamenJunkie’s Ethernet Temperature Probe based on Tweaking4All Probe”);
Serial.println(“-=-=-=-=-=-=-=-=-=-=-=-=-=-=-=-=-=-=-=-=-=-\n”);
Serial.print(“IP Address        : “);
Serial.println(Ethernet.localIP());
Serial.print(“Subnet Mask       : “);
Serial.println(Ethernet.subnetMask());
Serial.print(“Default Gateway IP: “);
Serial.println(Ethernet.gatewayIP());
Serial.print(“DNS Server IP     : “);
Serial.println(Ethernet.dnsServerIP());
}

void loop() {

unsigned long currentMillis=millis();

if((currentMillis – previousMillis) > 900000)
{
previousMillis=currentMillis;
// READ DATA
Serial.print(“DHT11, \t”);
int chk = DHT.read11(DHT11_PIN);
switch (chk)
{
case DHTLIB_OK:
Serial.print(“OK,\t”);
break;
case DHTLIB_ERROR_CHECKSUM:
Serial.print(“Checksum error,\t”);
break;
case DHTLIB_ERROR_TIMEOUT:
Serial.print(“Time out error,\t”);
break;
default:
Serial.print(“Unknown error,\t”);
break;
}

// if you get a connection, report back via serial:
if (client.connect(server, 80)) {
Serial.println(“-> Connected”);
// Make a HTTP request:
client.print( “GET /temps/add_data.php?”);
client.print(“serial=”);
client.print( “Probe1” );
client.print(“&”);
client.print(“temperature=”);
client.print(DHT.temperature,1);
//      client.print(“88”);
client.print(“&”);
client.print(“humid=”);
client.print(DHT.humidity,1);
//      client.print(“88″);
client.println( ” HTTP/1.1″);
client.print( “Host: ” );
client.println(server);
client.println( “Connection: close” );
client.println();
client.println();
client.stop();
}
else {
// you didn’t get a connection to the server:
Serial.println(“–> connection failed/n”);
}

}

Serial.print(currentMillis);
Serial.print(”  “);
Serial.println(previousMillis);

delay(10000);
}

A few notes to anyone wanting to try to use this.

  • You will need to set the server IP to the IP of your database.
  • You can alter the time interval between readings with the interval variable as well.
  • If you plan to use more than one Arduino probe (which you can), you’ll want to change the MAC address settings.  it can be any MAC value really since you’re just assigning it manually but having multiple devices with the same MAC will cause issues.  I’d recommend simply increasing the last value (31) by one.
  • You can change the line “client.print( “Probe1″ );” to name the probe whatever you want.  The original code read serial numbers but I’m not sure if DHT-11 handles serial numbers or not.  I’d also recommend changing it if you run more than one Arduino probe to the same database.

This will create basic output from the Arduino.  The other half of this is to set up a server running SQL to receive the data, but I’ll cover that in the next entry.  I based it off the code linked above in Tweaking4all but altered it to take in the Humidity as well as allow for viewing individual dates.

Tools I Use: Netscan and Fing

I wanted to do some occasional posts on some tools I use for various technical tasks.  Partially just to suggest some useful stuff, partially so I have some posts to reference anytime I reference said stuff.

I wanted to start off with Netscan and Fing, which serve the same basic purpose on two different platforms.  Both of these tools will scan the local IP range and return a list of every device connected to the network.  Netscan is what I use on windows, Fing is what I use on Android.

I use these tools very frequently, several times a week on average.  So what use is scanning the local network anyway?  I have two main uses, though both come down to Device Discovery.

Firstly, basic device discovery.  I’ve hooked something new to the network and I need to access it.  A lot of what I connect is headless with no easy way of discovering the IP aside from a scan.  An Arduino, a Raspberry Pi, a networked Webcam, all of these things need to be found once connected.  The scan is also useful for getting the MAC address of devices on the network.  The IP is dynamic on a network by network basis, a MAC address is a unique identifier.  Knowing the MAC address is useful for building firewall rules and setting up static IPs assigned by the router for devices like phones or laptops where assigning IPs on the device can get hairy.

The other reason for doing a network based scan is intrusion detection.  Generally speaking, I don’t expect to see hackers or anything on my home network.  This is more for checking things like “if my kids’ devices are connected” or occasionally if one of my kids has a new device borrowed or whatever that I am not aware of on the network.

Ultimately I want to set up a little network monitoring system on a server to do these sorts of checks in real time but both of these tools have served me well for years as doing the job quickly and simply.

Both are also useful for poking around foreign networks.  You can see what machines are on an open WiFi hotspot and see if they have any open shared files.  Though some open hotspots are smart enough to block such scans.

Arduino: Cheap Sensors Cheap Results…

Temperature and Humidity SenorsI mentioned last post I had ordered some cheap Temperature and Humidity Sensors for my Arduino boards.  Well they came in, and so I got to do some nice experimenting with code to test them out.  I already had a bit of code from the DHT Test Sketch (Arduino programs are called Sketches) that would poll one sensor and display the results over serial.  Sort of the ultimate goal here is potentially running several fo these sensors around the house and polling them to gather temperature data and store it in a data base that can be accessed via the web.

The first step is getting a Sketch that would poll each sensor and output the result over the serial monitor, preferably with labels.  I started out cutting and pasting the original single sensor code repeatedly and altering the pin before realizing a loop would be way more efficient for this task.  After some fiddling I came up with the following Sketch which polls pins 2-7 sequentially in 2 second intervals and outputs the data to the serial monitor.  This code requires the basic DHT includes from the DHT library.

//
//    FILE: Six Sensor Temp/Humidity Probe.ino
//  AUTHOR: Josh Miller
// VERSION: 0.1.00
// PURPOSE: DHT library based sketch for multiple Temp/Hum probes on Arduino
//     URL: http://www.joshmiller.net
//
// Released to the public domain
//

#include “dht.h”

dht DHT;

void setup()
{
Serial.begin(115200);
Serial.println(“Multi Sensor Temp/Humidity Readings”);
Serial.println(“Version 1.0”);
Serial.println(“Modified DHT Library Version”);
Serial.println(“By Josh Miller, josh@lameazoid.com”);
Serial.println();
}

void loop()
{
int i=1;

while (i<7)
{
// READ DATA

int chk = DHT.read11(i+1);
switch (chk)
{
case DHTLIB_OK:
Serial.print(“\t”);
break;
case DHTLIB_ERROR_CHECKSUM:
Serial.print(“Checksum error,\t”);
break;
case DHTLIB_ERROR_TIMEOUT:
Serial.print(“Time out error,\t”);
break;
default:
Serial.print(“Unknown error,\t”);
break;
}
// DISPLAY DATA
Serial.print(“Probe “);
Serial.print(i);
Serial.print(” : Humidity is: “);
Serial.print(DHT.humidity, 1);
Serial.print(“, Temperature is: “);
Serial.print(DHT.temperature, 1);
Serial.println(” C “);

i++;
delay(2000);
}

}
//
// END OF FILE
//

Arduino with 6 Senors...I don’t have my Network Shields yet so I can’t play around with getting these numbers to dump into an SQL database (probably one running on my NAS) just yet.  This basic proof of concept though is great since it allowed me to learn some code and test the basic functionality of the sensors.  This code can be modified for any number of sensors by changing the “while (i<7)” line to “while (i<# of Pins/sensors Used)”.

Wiring up the bread board was also a bit of a tricky task, mostly because of the sheer number of connections being made.  Each sensor gets a +Voltage and Ground connection off the bus bar and a wire from the senor.  The new cheap sensors use a different pin out from my “official” expensive senor, not really a problem, but something to look out for.

After wiring everything up, I could plug the Arduino into my laptop and open the serial monitor on the appropriate baud rate and record the results.  The results are actually a bit worrying but further testing will be needed to verify the integrity of the results…

Multi Sensor Temp/Humidity Readings
Version 1.0
Modified DHT Library Version
By Josh Miller, josh@lameazoid.com

Probe 1 : Humidity is: 58.0, Temperature is: 25.0 C
Probe 2 : Humidity is: 46.0, Temperature is: 27.0 C
Probe 3 : Humidity is: 41.0, Temperature is: 29.0 C
Probe 4 : Humidity is: 40.0, Temperature is: 26.0 C
Probe 5 : Humidity is: 35.0, Temperature is: 30.0 C
Probe 6 : Humidity is: 36.0, Temperature is: 32.0 C
Probe 1 : Humidity is: 58.0, Temperature is: 25.0 C
Probe 2 : Humidity is: 46.0, Temperature is: 27.0 C
Probe 3 : Humidity is: 41.0, Temperature is: 29.0 C
Probe 4 : Humidity is: 40.0, Temperature is: 26.0 C
Probe 5 : Humidity is: 35.0, Temperature is: 30.0 C
Probe 6 : Humidity is: 36.0, Temperature is: 31.0 C
Probe 1 : Humidity is: 58.0, Temperature is: 25.0 C
Probe 2 : Humidity is: 46.0, Temperature is: 27.0 C
Probe 3 : Humidity is: 42.0, Temperature is: 29.0 C
Probe 4 : Humidity is: 40.0, Temperature is: 26.0 C
Probe 5 : Humidity is: 36.0, Temperature is: 30.0 C
Probe 6 : Humidity is: 37.0, Temperature is: 30.0 C
Probe 1 : Humidity is: 58.0, Temperature is: 25.0 C
Probe 2 : Humidity is: 46.0, Temperature is: 27.0 C
Probe 3 : Humidity is: 42.0, Temperature is: 29.0 C
Probe 4 : Humidity is: 40.0, Temperature is: 26.0 C
Probe 5 : Humidity is: 36.0, Temperature is: 29.0 C
Probe 6 : Humidity is: 37.0, Temperature is: 30.0 C
Probe 1 : Humidity is: 58.0, Temperature is: 25.0 C
Probe 2 : Humidity is: 46.0, Temperature is: 27.0 C
Probe 3 : Humidity is: 43.0, Temperature is: 28.0 C
Probe 4 : Humidity is: 40.0, Temperature is: 26.0 C
Probe 5 : Humidity is: 36.0, Temperature is: 29.0 C
Probe 6 : Humidity is: 38.0, Temperature is: 30.0 C

Probe 1 is the official sensor, the one that cost me $10, the other 5 are cheap probes, they cost me like $9 total.  I have to assume that Probe 1 is pretty accurate and probably has gone through some quality testing before being sold.  The other 5, for all I know, are rejects that were swept off of some floor in China by the janitor.  The point is, all of the readings of the cheap sensors are pretty off from each other, especially the humidity.  This may actually be the case if these sensors were in separate rooms or even any distance from each other, however, these senzors are all within a few centimeters of each other on the same bread board.

There may be a few things happening here causing this discrepancy, and I only say this because they are at the very least consistent with themselves.

One, it’s possible, that there isn’t enough juice to run all of the sensors at once.  If they are being under powered, I would likely get bad readings.  I can easily test this by running each sensor independently with the old single probe Sketch.

Two, it’s possible that while no accurate to each other, they are accurate to themselves.  I don’t really know what these numbers actually mean, I am assuming % Humidity and Degrees C.  It may be some sort of internal scale factor and I simple need to adapt the program to return scaled results.  The issue with this will be that each probe is polled in a loop, so there isn’t really an easy way to apply a different scale factor to each sensor individually.

Whatever the case, the Temperature is at least semi precise, which is what I care more about anyway.  I’ll probably continue with the project with the idea that if I really want accurate results I could eventually invest in better sensors.  The next step on the software end will be to add network functionality to record the data.  On the hardware end I plan to use some CAT5 wire to allow the probes to be positioned in various places beyond just the Bread Board.