Helping Myself to Ensure Better Productivity
I find as I get older, I am not so great at remembering everything that I really should be doing regularly. Not just necessary things, but things I want to to. I’ve been working out some better systems to push myself to keep up with all of these sort of little tasks.
Microsoft ToDo
Any ToDo list app works here, I use Microsoft ToDo. I used to use Wonderlist, but Microsoft bought them out and it’s essentially folding into MS ToDo. I try to keep my lists somewhat streamlined down so it doesn’t become a cluttered mess. For example…
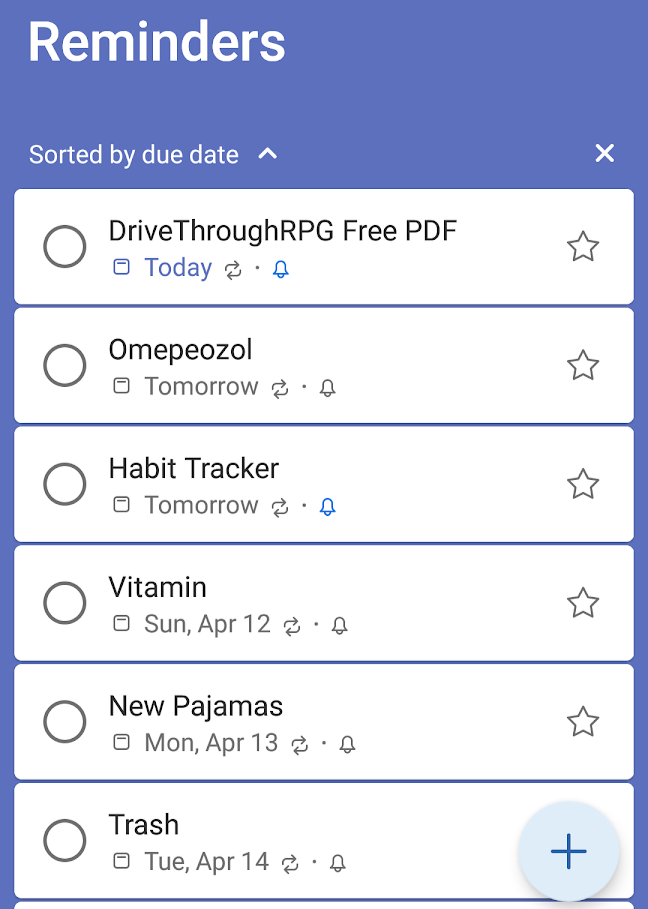
The Reminders List. All of my regular reminders go here. Every week I get a reminder to take out the trash after work. The same goes for Recycling. I get daily reminders in the morning for taking my vitamin and just before lunch to take my Acid reducer medicine. I get weekly reminders for other regular tasks as well, such as redeeming my Forza Rewards in the game Forza, checking on the free PDF of the week on Drivethrough RPG, and redeeming the free game of the week on the Epic Game Store. I also have Monthly reminders for checking on several auto-withdraw bill payments, or changing the furnace filter. I’ve got an irregular reminder to change out my pajamas every few days because I can never keep track of how many days I have worn the same pajamas.
The Grocery List. It’s called Grocery, but it’s more of a general list of more pressing things todo or purchase. It is often, just groceries though.
General ToDo Lists. I have lists for movies or TV I want to watch, books I want to read, projects, and I might want to do someday in the future.
The Calendar
I have also started using my calendar a lot more aggressively. I have several sub calendars going on different types of events as well. I do keep some reminder style tasks on the calendar instead of the ToDo List app as well. The general difference is that ToDo List reminders are effectively “never ending”, while Calendar Reminders are more ephemeral and have a set period of time. For example, Hasbro was running a contest on their Instagram for ten days, I used the calendar to schedule ten days of reminders.

The calendar has become extra useful during this COVID-19 time as well. A lot of musical acts are doing online shows. And since my plan to go to more concerts clearly isn’t going to go anywhere at this time, I can at least set up events to remind myself when live shows are going on.
I also use it to mark out generic blocks for work events, so I can better keep track of what I might have going on for scheduling other activities like Doctor’s appointments.
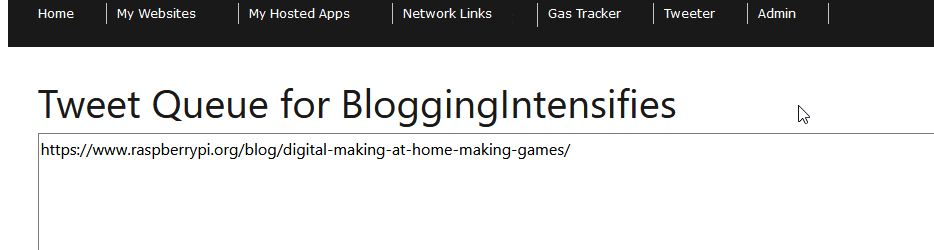
Send To Device
Something else I have been trying to push myself on, is taking care of things *now*. Or at least soon. Often I would come across things I want to download, or little projects to set up and try, often while browsing on my phone. This used to end up in one of two things. I would leave the tab open forever on my phone, or I would book mark it and forget about it.
I use Firefox on my phone and my PCs, so the bookmarks all sync, but I still have to remember to check them.
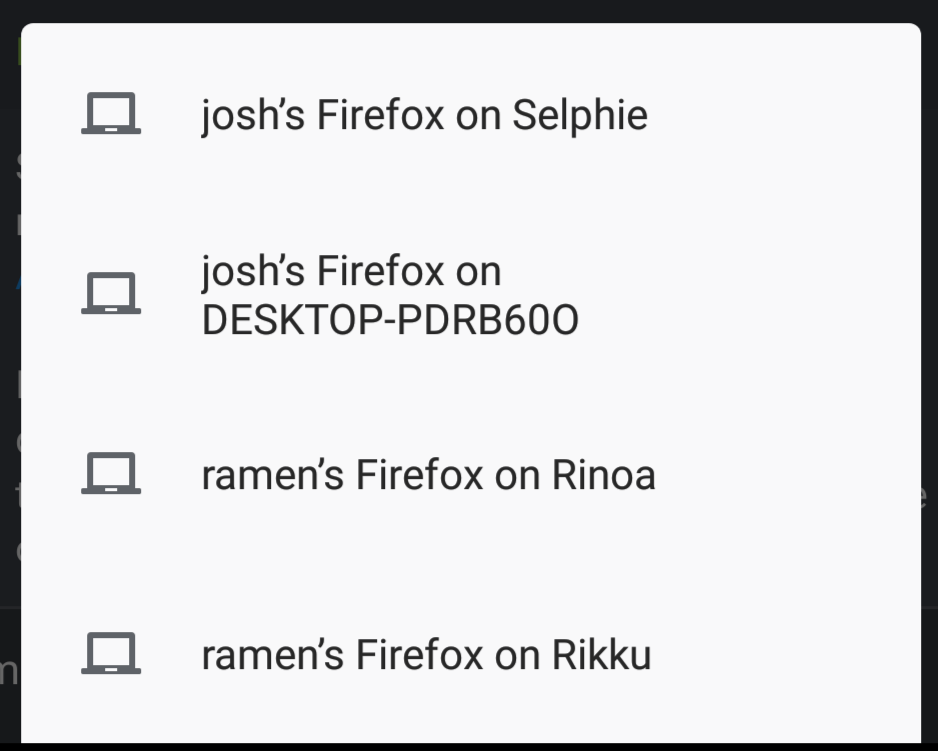
What I have discovered that I’ve been doing more is the “Send to Device” feature. I can take a tab on my phone and send it to either my Laptop or Desktop, instead of book marking it. This way, when I sit down and open up the appropriate device, that tab will show up, and be in my face as a reminder of “Do this NOW”. It’s really helped with actually taking care of some quick tasks that I may find while on my phone, but aren’t convenient to do immediately.
Track All the Things
I am going to keep this short, because it really needs to be it’s own post, but I have started heaving tracking a lot of aspects of what I do with my time. I don’t really DO anything with this data, but it motivates me in two ways.
The tracking itself is a thing that pops up as a reminder of something that needs done. Not having anything to fill in, makes me feel a little guilty about my productivity. It’s sort of an angle of negative self reinforcement.
Two, I like doing it, even if nothing comes of it.
Like I said, I will probably do a separate post, but I have been tracking:
- TV I watch
- Movies I watch
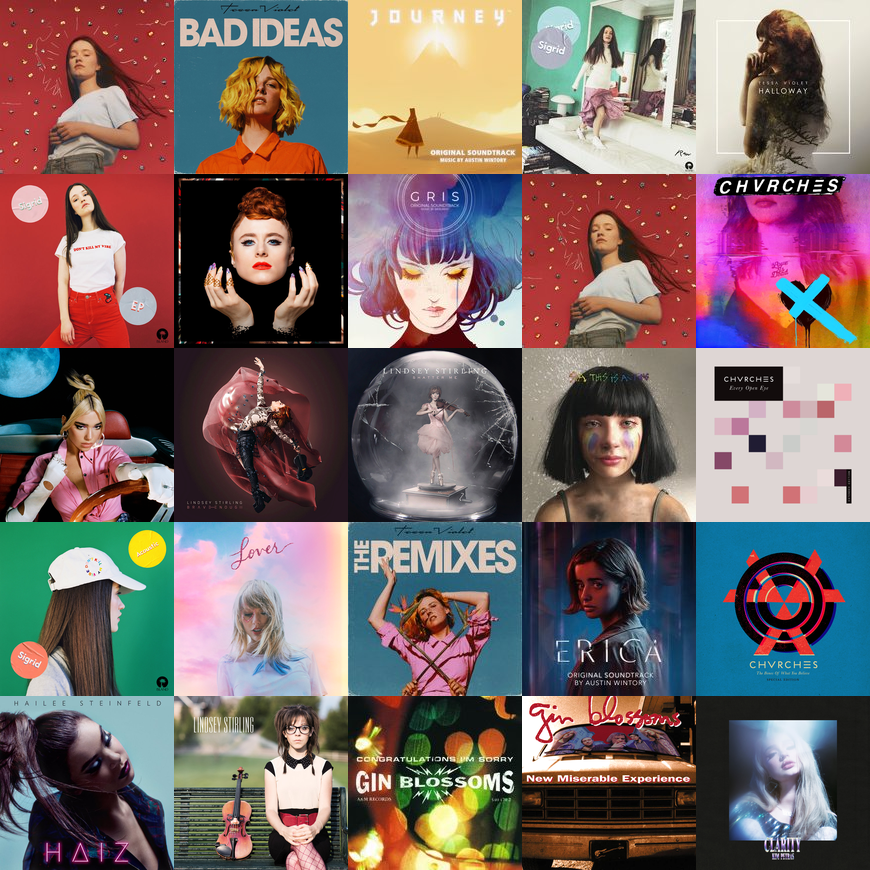
- Music I Listen To
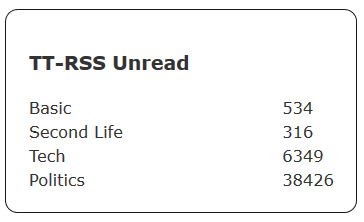
- Books I’ve read
- Online Courses I’ve done
- My Mood, 2x a day
- How much Duolingo I do each day
- Fitness (Steps, Push Ups, Sit Ups)
- How often I shave or get my hair cut
- General Health Issues
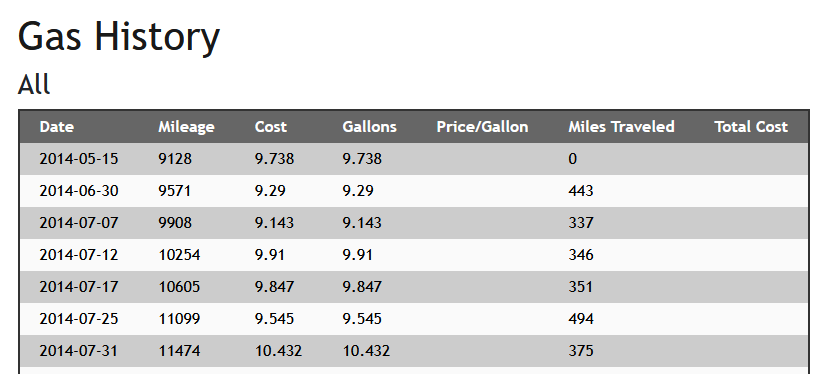
- Gas Consumption
- Basically everything
I use several apps for this and some spreadsheets. But more on all that later.