2020

Tracking Covid-19 into a database using Python

At some point I need to do a little write up on my Home Dashboard Project, it’s inspired quite a few minor projects such as this one to make little web widgets. The dashboard is the simple part, it’s just dumping a database query into a table. Honestly, the script was easy too, because I adapted it from another script I built recently.

With COVID-19 all over the news, I wanted to add some stats to my dashboard for my state. Not so much because there aren’t already 1000 other places to get the numbers, but more to see if I could do it. The hardest part was finding a feed to stats. Then I found CovidTracking.com. Which has a nice little API. I then set to work adapting another script to pull from this API to dump stats for Illinois into the database. I am only interested in Illinois, but the script is built so the user can put a list of states into an array, and then it will loop through and add them all to the database.

The script is below, but this also requires some set up in SQL. Nothing complicated, mostly INT fields. an id as an int and primary key, negative_cases, positive_cases, and deaths, all as INT, state as a varchar with a length of 2, though technically the length is optional, then finally date_stamp as a DATETIME field with a default value of the current timestamp. The DATETIME isn’t directly touched here, but it makes it easier to manipulate the data later.

The code also requires you enter your database credentials. I’ve nammed my table “il_covid_stats, but you can change that to whatever you want down below in the “SQL = “INSERT….” line. I’ll leave it up to you what to do with the data, I pull mine into a PHP page.

Anyway, here is the python code:

# Python Covid Star Tracking to SQL
# use of json package
# Sample URL: https://covidtracking.com/api/states?state=IL

import json
import requests
import time
import MySQLdb

mydb = MySQLdb.connect(
  host="localhost",
  user="YOUR_DB_USERNAME",
  passwd="YOUR_DB_PASSWORD",
  database="YOUR_DB_NAME"
)
mycursor = mydb.cursor()
user_agent = 'Mozilla/5.0 (Macintosh; Intel Mac OS X 10_9_3) AppleWebKit/537.36 (KHTML, like Gecko) Chrome/35.0.1916.47 Safari/537.36'

#States to check as an Array, two letter abbreviations
states = ['IL']

def data_getter(statename):
  ####when reading from remote URL
  url = 'https://covidtracking.com/api/states?state='+statename

  user_agent = 'Mozilla/5.0 (Macintosh; Intel Mac OS X 10_9_3) AppleWebKit/537.36 (KHTML, like Gecko) Chrome/35.0.1916.47 Safari/537.36'
  headers = {'User-Agent': user_agent}
  response = requests.get(url,headers=headers)
  html = response.content
  statedata = json.loads(html)

  pos_cases = (statedata['positive'])
  neg_cases = (statedata['negative'])
  deaths = (statedata['death'])

  vals = (pos_cases,neg_cases,deaths,statename)

  mysqlinsert(vals)

def mysqlinsert(vals):
  ## This database name and columns can be changed but should be pre made in your database
  SQL = "INSERT INTO il_covid_stats (positive_cases, negative_cases, deaths, state) VALUES (%s, %s, %s, %s)"
  mycursor.execute(SQL, vals)
  mydb.commit()

# Loop through URLs for each state
for i in states:
  data_getter(i)

Code Project: Network Map Webpage, Making it Better

I wrote a bit about my Network Map Webpage recently. It’s part of a larger home dashboard project I’m working on, but as part of that I’ve updated things a bit to make them more streamlined and easier to use. The biggest problem with the page as it was originally coded is that it shows everything. I’ve cycled most of my regularly used electronics onto the network so they could be captured by an arp scan, though not all of them are on all the time. For example, I still have a Raspbery Pi and Arduino set up to capture temperature data. I also have several Next Thing CHIP devices, though Next Thing has gone out of business. In total, between my IOT stuff and laptops, phones and tablets and the duplicate IPs from the network extender, I have 55 devices in the raw table.

So I set out to make this more manageable at a glance. My original query in my PHP code looked something like this:

SELECT ip, arpscans.mac, arpscans_known_macs.device_name, arpscans_known_macs.device_description, last_seen, device_owners.user_name FROM arpscans LEFT JOIN arpscans_known_macs on arpscans_known_macs.mac = arpscans.mac LEFT JOIN device_owners on device_owners.id = arpscans_known_macs.device_owner ORDER BY ip

By slipping in “WHERE last_seen >= NOW() – INTERVAL 5 MINUTE” just before ORDER BY, I can make the code return only currently connected devices. The ARP scan runs every 5 minutes, anything that has a last seen time stamp within 5 minutes is assumed to still be attached. This interval could be shorted to almost real time, but I don’t really need that much of a check.

I can also view all disconnected devices with a simple change of the above command, making it “WHERE last_seen <= NOW() – INTERVAL 5 MINUTE”. This wouldn’t work if I were still keeping historical data, but I essentially only capture the last seen data for any device. Essentially what this does is return everything not seen in the last 5 minutes.

I also broke out my PHP code that builds my table from my query into it’s own PHP function. This was I could set the variable $SQL for the active devices, call the function to build the table, then set $SQL for inactive devices and build a second table, under the first.

I immediately scrapped this, because it was ugly. Plus, sometimes I do want to see “everything”.

Enter some GET calls and an if/else statement.

	if($_GET['show'] == "active") {
	// SQL for selecting active devices
	$tabletitle="Active Devices";
	$sql = "SELECT ip, arpscans.mac, arpscans_known_macs.device_name, arpscans_known_macs.device_description, last_seen, device_owners.user_name FROM arpscans LEFT JOIN arpscans_known_macs on arpscans_known_macs.mac = arpscans.mac LEFT JOIN device_owners on device_owners.id = arpscans_known_macs.device_owner WHERE last_seen >= NOW() - INTERVAL 5 MINUTE ORDER BY ip";
	}
	elseif($_GET['show'] == "inactive") {
	// SQL for selecting active devices
	$tabletitle="Inactive Devices";
	$sql = "SELECT ip, arpscans.mac, arpscans_known_macs.device_name, arpscans_known_macs.device_description, last_seen, device_owners.user_name FROM arpscans LEFT JOIN arpscans_known_macs on arpscans_known_macs.mac = arpscans.mac LEFT JOIN device_owners on device_owners.id = arpscans_known_macs.device_owner WHERE last_seen <= NOW() - INTERVAL 5 MINUTE ORDER BY ip";
	}
	else {
	// SQL for Selecting all devices
	$tabletitle="All Devices";
	$sql = "SELECT ip, arpscans.mac, arpscans_known_macs.device_name, arpscans_known_macs.device_description, last_seen, device_owners.user_name FROM arpscans LEFT JOIN arpscans_known_macs on arpscans_known_macs.mac = arpscans.mac LEFT JOIN device_owners on device_owners.id = arpscans_known_macs.device_owner ORDER BY ip";
	}

Basically, if nothing, or a random string is passed by the URL variable “show”, then it goes to the end, and displays everything when accessing the page at index.php. If it passes index.php?show=active, it sets $SQL for showing active devices and if it gets index.php?show=inactive, it shows inactive devices. It also sets a variable called $tabletitle which is just echoed out into some header tags. I then added links across the top of the page to each of these filters.

This allows for a quick and easy toggle of which data is pulled and displayed.

Additionally, I updated the way the Add Device form works. Previously, the form would fill in the MAC, a Device Name and a Device Description, then it would POST to another PHP page that would insert the data into the table, then forward on back to the index page with a header redirect. I’m not going to get into too much detail on it here, but I also integrated the Network Map into my dashboard framework with a header, navigation, sidebar, and footer. It also uses a table based navigation system, so in order to view the network map, I am hitting “index.php?page=4”. Pages basically all need to be wrapped in this structure to work properly, so in order to make things flow better, the Add Device form now POSTs back to the Network Map page itself, which checks to see if the POST variables are set, and if they are, it inserts the new information, before pulling the table.

This also meant slightly altering my page calls to look for “index.php?page=4&show=active” and “index.php?page=4&show=inactive”.

Eventually I want to move the Add Device form to appear at the top of the page, so the whole thing is all handled in one single page.

Lastly, I made up a quick block of code in it’s own page, that simple counts and displays the number of currently connected devices on the network. This block is embedded on the front page of my Dashboard Framework and links to the full Network Map page. The general idea on the Dashboard is to have widgets like this that show quick glance information, with links to detailed information.

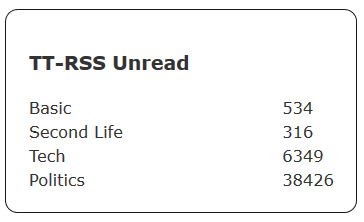
I have not built a lot of them yet, but one of the others I have built works somewhat similar to the ARP scanning system. A script makes a call to my TT-RSS instance for each of the segmented accounts I have, then dumps the unread count into a table on the server. The widget shows how many unread articles each topic/account has. I am still really bad about only actually reading the Basic feed (mostly Toys and Video Games).

But I will get into the Dashboard Widgets thing a bit more in a future post probably.

My Music Listening Habits for February 2020

Not a whole ton that’s overly exciting this month. I did listen to quite a bit of BT, whom is one of my all time favorite artists, even if my time listening to his stuff comes and goes. I think there was a bit of earlier stuff that I didn’t associate as being BT that I liked, but I remember that Never Gonna Come Back Down was the track that really got me into listening to more of BT’s music. It was on the soundtrack for Gone in 60 Seconds. In the actual movie, they play this really neat super low key remix of Never Gonna Come Back Down that I have never been able to find a copy of anywhere. It occurs when they are stealing the Ferraris from the garage.

Another older album I used to listen to on repeat that came back briefly this month was Rollergirl. Last.fm suggests Rollergirl hasn’t had a release since 2002, which is probably around the time I was listening to this music. Also, apparently Roller girl is some German dude.

Still plenty of Sigrid and Tessa Violet going on. Plus a bit more CHVRCHES this month. I have to say, the more I listen to CHVRCHES, the more I like their stuff. Not that I didn’t like it before, I just, like it more.

Anyway, I’m just gonna close out here with a little Spotify Playlist I made up that collects together the more low key Sigrid tracks available on the service.